Analytics & Tracking
Analytics Page
Understand every chart and metric on the Analytics screen.
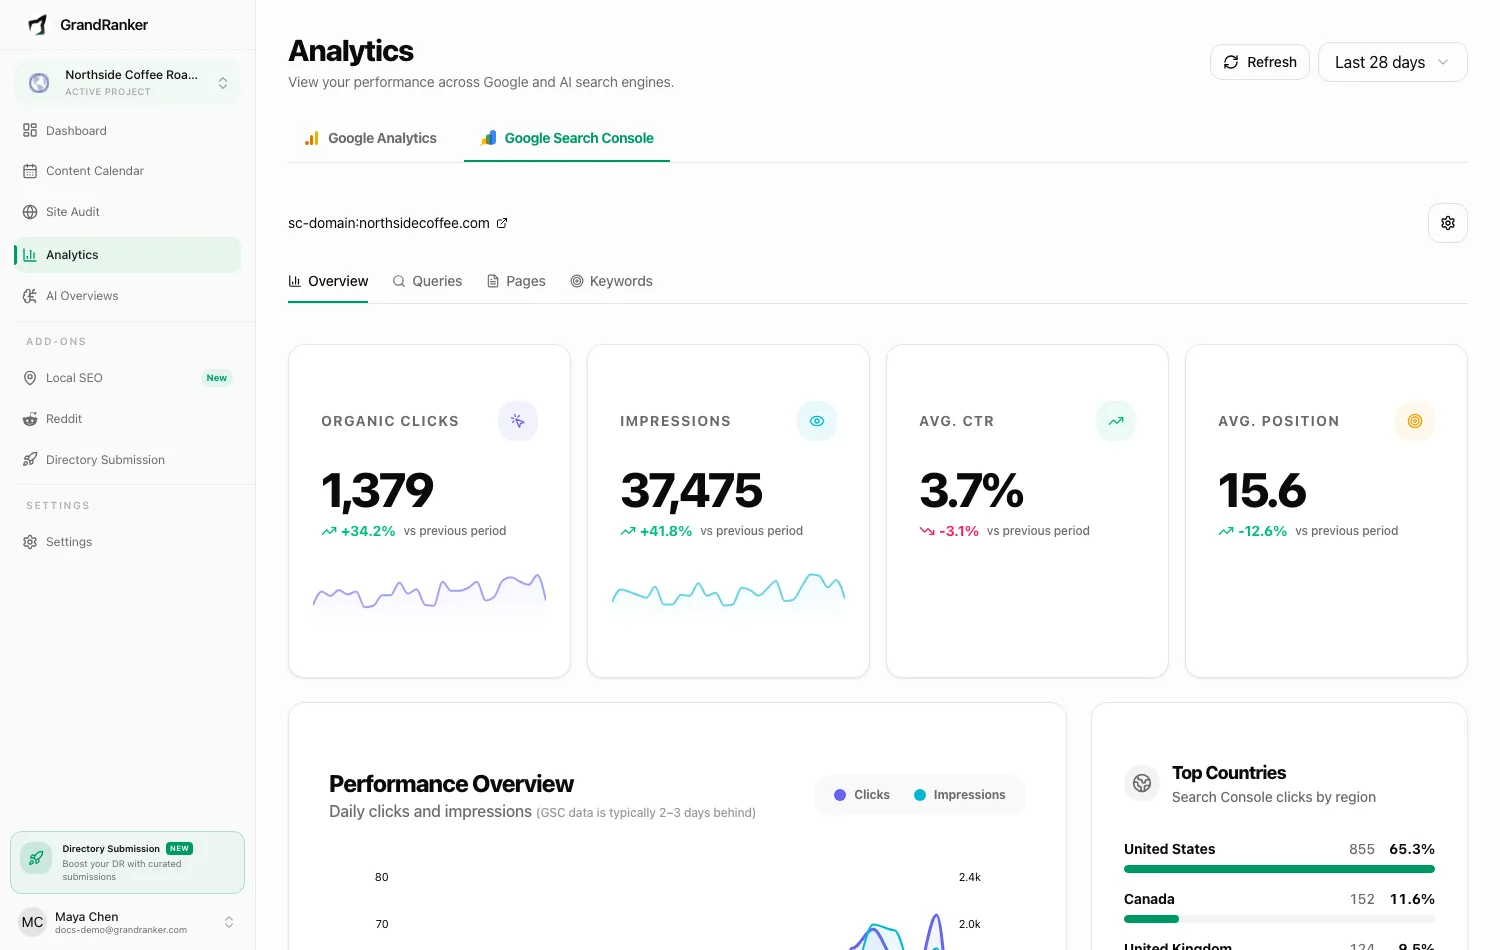
The Analytics page has two tabs — Google Analytics (traffic) and Google Search Console (search performance) — a period selector (7/28/90 days or 12 months) and a Refresh button.
No Google account connected yet? You'll see two connect cards: Search Console and Google Analytics 4. Both are read-only.
Google Search Console tab
Header shows the connected property with a settings menu (Change Property, Open in Google, Disconnect). Four views below:
Overview
- Metric cards: Organic Clicks, Impressions, Avg. CTR, Avg. Position, each vs the previous period. For position, lower is better.
- Performance Overview: daily clicks and impressions.
- Top Countries: clicks by region.
- Traffic Segmentation: brand vs non-brand queries, with clicks, impressions and average position for each.
Queries
Top Search Queries with clicks, impressions, CTR and position. Positions are color-coded: green for top 3, blue for top 10.
Pages
Top Performing Pages ranked by clicks and impressions, each linked to the live page.
Keywords
Ranked Keywords with Google's own averaged position — not Grandranker's Rank Tracking. Use Rank Tracking to follow specific keywords day by day.
Google Analytics tab
Users, Sessions, Pageviews, Bounce Rate and Avg Duration cards, plus a daily Traffic Overview chart, Devices breakdown, Top Sources and Top Pages. See the GA4 guide.
FAQ
Why do the last few days look low or empty?
Search Console data is typically 2-3 days behind.
What does "vs previous period" compare?
The same-length window right before your selected period.
Why is the position number higher than what I see myself?
It's averaged across every impression in the period, including other countries and rare phrasings — a single check is one data point.
Why don't the GSC and GA4 numbers match?
GSC counts clicks from Google search; GA4 counts sessions from all sources. A gap is normal.
Do I need both connections?
No, each tab works alone. But GA4-only means traffic without rankings, and GSC-only means rankings without on-site behavior.
Still stuck? [email protected]